7 Prospect theory
Prospect theory (Kahneman and Tversky (1979)) is a descriptive theory of the decisions people make when faced with a gamble. It is not a theory of how people make decisions, nor a theory of how they should make decisions.
You have covered prospect theory and its components in earlier units. Here is a recap.
7.1 Reference dependence
- You have not checked your share portfolio in a while. You expect it is worth around $40,000. Today when you check, it is worth $30,000. Do you feel rich or poor?
- You have not checked your share portfolio in a while. You expect it is worth around $20,000. Today when you check, it is worth $30,000. Do you feel rich or poor?
People assess choices based on their reference point - where they currently are - as opposed to an overarching assessment of their position. Potential outcomes are coded as losses and gains relative to that reference point.
Reference points can be thought of a state to which you have become adapted.
Under expected utility theory, utility is typically thought of as being the product of your entire wealth (\(W\)). For example, if you gain $100, your utility increases from \(u(W)\) to \(u(W+\$100)\).
In contrast, under prospect theory, the value function (what the utility function is typically called in prospect theory) applies to changes relative to the reference point. If their initial reference point is their wealth before receiving the $100, the value of that change is \(v(\$100)\). The importance of that distinction becomes apparent when we consider how people consider losses and gains.
7.2 Loss aversion
You are offered a gamble on the toss of a coin. If you flip a heads, you lose $100. If you flip a tails, you win $150. Do you accept the gamble?
Loss aversion is the concept that losses loom larger than gains. People feel a loss more strongly about a loss than they do an equivalent gain, so are often willing to reject gambles with a materially positive expected value.
Rejection of bets of this nature cannot easily be explained by risk aversion. As shown by Rabin (2000), rejection of bets over moderate stakes requires absurd rates of risk aversion. For instance, if a person who acts consistent with expected utility theory always turns down a 50:50 bet to win $110 or lose $100 whatever their initial level of wealth, they will also turn down a 50:50 bet to win $1 billion, lose $1,000. (See Rabin and Thaler (2001) for a readable presentation of Rabin’s calibration theorem.)
The following is an example of a value function with reference dependence and loss aversion:
\[v(x)= \bigg\{\begin{matrix} x &\text{where} &x \geq 0\\ 2x &\text{where} &x<0 \end{matrix}\]
Where \(x\) is the outcome relative to the reference point.
For example, suppose someone is given $100. If their initial reference point is their wealth before receiving the $100, \(x\) will be $100. Therefore their utility is +100. If the same person instead loses $100, their utility would be -200.
7.3 Reflection effect
Kahneman and Tversky (1984) reported the following experiment:
Imagine that the U.S. is preparing for the outbreak of an unusual Asian disease, which is expected to kill 600 people. Two alternative programs to combat the disease have been proposed. Assume that the exact scientific estimates of the consequences of the pro-grams are as follows:
If Program A is adopted, 200 people will be saved.
If Program B is adopted, there is a one-third probability that 600 people will be saved and a two-thirds probability that no people will be saved.
Which of the two programs would you favor?
In the initial experiment, 72% of participants chose option A.
But what if the experimental participants were presented with the following options?
If Program C is adopted, 400 people will die.
If Program D is adopted, there is a one-third probability that nobody will die and a two-thirds probability that 600 people will die.
Only 22% chose option C, despite it being equivalent to option A.
This phenomena is the reflection effect. When people make a risky choice related to gains, they are risk averse. They prefer a certain option with lower expected utility than the expected utility of the risky choice. When making a choice in the loss domain, they become risk seeking.
This phenomena might also be thought of as diminishing sensitivity to gains or losses in either direction. This contrasts with expected utility theory where the pain of losses increases as they grow in size.
The following value function is an example of a function where there is diminishing sensitivity to both gains and losses.
\[\begin{equation*} v(x)= \Bigg\{ \begin{matrix} x^\frac{1}{2} &\text{where} &x\geq 0\\ -2(-x)^\frac{1}{2} &\text{where} &x<0 \end{matrix} \end{equation*}\]
The combination of loss aversion and the reflection effect results in the famous value function as in the following diagram:

7.4 Probability weighting
- You are granted entry into a prize draw that that gives you a 5% probability of gaining $10,000. How do you feel?
- You are granted an additional entry into a prize draw for $10,000 that increases your probability of winning from 5% to 10%. How do you feel?
- You are granted an additional entry into a prize draw for $10,000 that increases your probability of winning from 50% to 55%. How do you feel?
- You are granted an additional entry into a prize draw for $10,000 that increases your probability of winning from 95% to 100%. How do you feel?
From the perspective of expected utility theory, each of these four scenarios results in the same expected gain of $500. But they often feel markedly different.
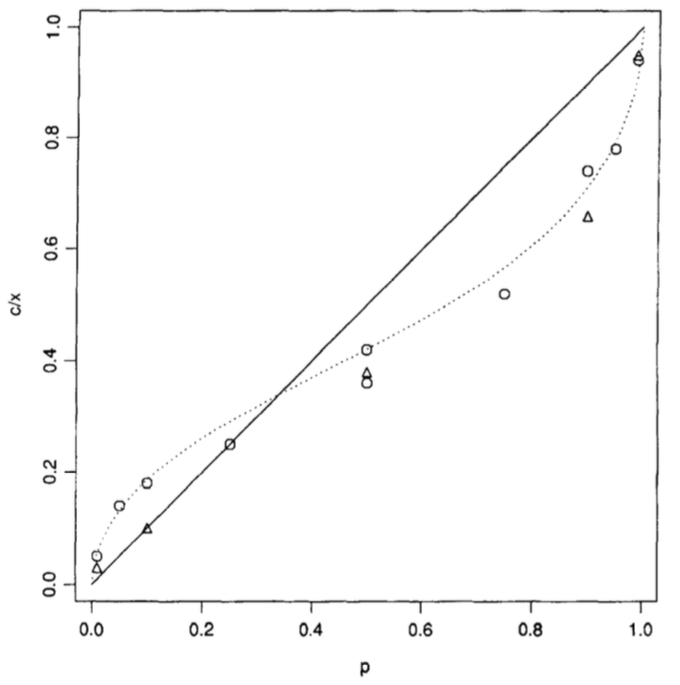
People overweight small probabilities, giving them disproportionately more weight than they deserve. They also underweight large probabilities that fall short of certainty, giving them less weight than is justified. This results in the shifts in scenarios 1 and 4 above generally being received more gratefully than that in scenarios 2 and 3.
Kahneman (2011) calls the large psychological value of the change from 0 to 5% (or some other small probability) the possibility effect. Very unlikely but possibles outcomes are given more weight than similar increases in probability for events that are already possible. He calls the large psychological value of the change to 100% the certainty effect. We will pay a lot more for certainty than near certainty.
Combining this with the other components of prospect theory, the value of a prospect can be said to be:
\[\begin{align*} V&=\sum_{i=1}^n\pi_iv(x_i)\\[6pt] &=\pi_1v(x_1)+\pi_2v(x_2)+...+\pi_nv(x_n) \end{align*}\]
Where \(\pi_i\) is the subjective probability of realising prospect \(x_i\).
This pattern of probability weighting can be seen in the following diagram, where the probability \(p\) on the x axis is mapped to a new probability weight on the y axis.
7.5 Fourfold pattern of risk attitudes
Prospect theory results in a four-fold pattern of risk attitudes, as shown in this table. For moderate to high probability gambles, the reflection effect dominates and people are risk averse in the domain of gains and risk seeking in the domain of losses.
But for low probability gambles, the probability weighting shifts the decision calculus. The possibility of a gain is overweighted, making the gamble attractive and inducing risk seeking behaviour. A similar effect occurs for a low probability of loss, with the overweighted probability making the potential loss less attractive, inducing risk averse behaviour.
| Gains | Losses | |
|---|---|---|
| Medium to high probability | Risk aversion | Risk seeking |
| Low probability (possibility effect) | Rick seeking | Risk aversion |