21 Product distribution
The process of product distribution often results in the wrong customers being in the wrong products.
21.1 Defaults
Defaults are a powerful distribution feature.
Automatic enrolment of employees into retirement savings plans has been one of the most successful behavioural interventions to shift employee behaviour. Madrian and Shea (2001) examined automatic enrolment in 401(k) plans. They found that participation was materially increased. Among those with 3 to 15 months tenure, the increase due to default enrolment was an increase from around 37% to 86% participation.
In the case of retirement savings in Australia, we have a mandatory default requirement to contribute a portion of our salary. Obviously, it is successful in achieving higher participation in retirement savings.
The Australian superannuation system also has voluntary defaults in the form of the particular superannuation provider (an employer selected default) and the investment options within that provider. The stickiness of those defaults and the high fees (poor outcomes) led to the “MySuper” legislation with default low-fee low-frill accounts. Around two out of three members stick with their fund’s default option, so defaulting into the best designed option could deliver substantial benefits (Kingston and Thorp (2019)).
Defaults are also set for death, total permanent disability and income insurance within superannuation. As for default funds, these are sticky. The question then becomes what default is better for customers. Recent government reforms mean that account holders are not defaulted into insurance if they are under 25 or have a balance of less than $6000.
21.2 Advice
One major method of financial product distribution is the advice channel. People see an adviser who can recommend products and provide ongoing advice as what steps they should take to meet their financial goals.
Given the psychological factors affecting financial decision making, advice could be seen as a way to enlist an expert less subject to those weaknesses. However, there is considerable evidence that advisors do a poor job for their customers. For instance, Australian Securities and Investments Commission (2012) assessment of advice obtained through a shadow shopping exercise rated 3% of the advice as good quality. In contrast, 86% of participants in the study felt they had received good advice. This matches evidence from around the world.
21.2.1 Adviser incentives and competence
The rational explanations for this poor advice primarily rest on the incentive structure experienced by the advisors. For example, Mullainathan et al. (2012) showed that advisers tend to either support the mistaken beliefs of their clients or argue against their correct beliefs whenever it was in the adviser’s interests to do so. There is also empirical evidence that consumers largely naive about this conflict.
An alternative explanation for poor advice is that advisors lack competence. Linnainmaa et al. (2021) found that advisers tend to invest in accordance with the advice given to their clients. They trade too frequently, chase past returns, and invest in expensive actively managed funds. The result is that their returns are similar to their clients’ net returns.
21.2.2 Accepting advice
Many adviser clients follow poor advice or fail to follow good advice. Often base this on trust, but trust can be formed on factors such as credentials and first impressions (including confirming the client’s own views) (Agnew et al. (2018)).
Part of the advice task is to create advice that is compatible with the client’s psychology. Advice that is sub-optimal but that is followed may be superior to optimal advice that the client does not accept. Determining a framework to manage anxiety and emotional comfort over time can be as important as the initial advice.
As an example, consider the equity premium puzzle and Bernartzi and Thaler’s (1995) explanation.
Suppose an investor has a choice between risky stocks, with an expected annual return of 7% and standard deviation of 20%, and a sure return of 1%. The attractiveness of stocks to a loss averse investor will depend on both the time horizon of the investor and the frequency with which they evaluate the returns. If they monitor their portfolio frequently, they will often observe losses from stocks, which they feel with greater force than gains.
Suppose that one loss averse investor examines their portfolio every day. Since on a daily basis stocks go down almost as often as they go up, this investor will experience a lot of pain, making the stocks unattractive. Another loss averse investor only checks in on their portfolio once a decade. At that horizon, stocks have only a small probability of losing money, so will be much more attractive to someone who is loss averse.
It is a combination of loss aversion and a short evaluation period that will drive an investor to require a large premium for holding the risky option. Benartzi and Thaler call this myopic loss aversion.
An adviser that can set up a framework where their client only periodically checks their portfolio may be more likely to have that client adhere to their ongoing advice.
21.3 Marketing and advertising
The way in which information is provided through the distribution and sales process can markedly change customer outcomes.
The most salient way in which this occurs is marketing and advertising. As one example, research by Hastings et al. (2017) into the privatised Mexican social security system found that marketing raises demand for financial products, and lowers the price elasticity of demand (low elasticity means price goes up, but demand doesn’t go down). This enabled the system to have fees so high that the average fee would reduce a 100 peso deposit to 95 pesos five years later even when the investments earned a 5% annual return.
Similarly, research by Gurun et al. (2016) into the US mortgage market found that lenders sell more expensive mortgages in regions where they advertise more.
Part of the way in which these negative effects occur is that firms make appealing attributes salient, and shroud fee and quality problems. Customers don’t seem to infer that what is hidden is bad news. For instance, UK research by Armstrong and Vickers (2012) found that a small cohort of bank customers often suffer repeated “unexpected” overdraft charges. These fees were easily found after a few clicks on the bank’s website, but were effectively hidden relative to other features of the accounts.
This leads to an obvious intervention of ensuring advertising covers more than just the positive attributes of a product, possibly enabling a better decision. Are the long-term interest rates advertised with the same salience as the honeymoon rate? However, if a product is poorly designed (e.g. excessive fees), there is no way to fix this through marketing.
21.4 Voluntary disclosure
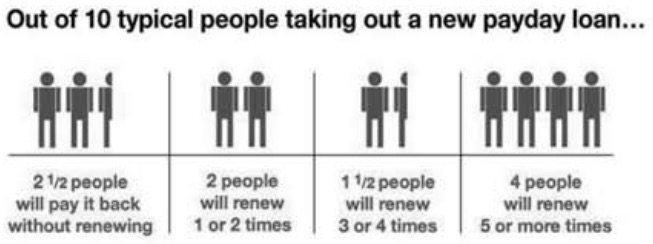
Bertrand and Morse (2011) trialled information disclosure in a field experiment in payday lending stores in the United States. They included one of the following three designs on the loan documentation envelopes.
Dollar information
One treatment provided the customer with dollar information on accumulated fees over time, compared with same amount on credit card.

Customers who received this treatment were 5.9 percentage points less likely to borrow in the pay cycle following the intervention (an 11% decline relative to the control group). They also reduced the amount borrowed if they did return by 23%. The success of this intervention suggests an initial lack of understanding of the power of compounding (financial literacy).
Comparison of annual percentage rates
Although regulation already required lenders to provide an annualised percentage rate to customers, this treatment involved comparison of the annualised percentage rate of the payday loan with other financial instruments that the customers are likely familiar with.
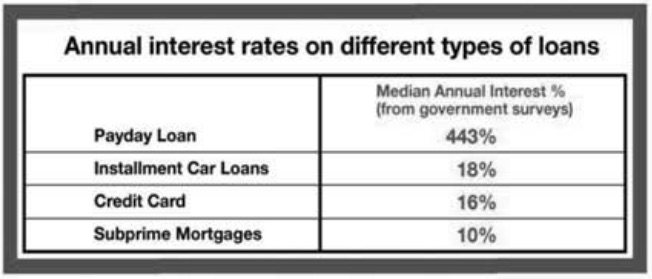
Customers who were provided with the annual percentage rate comparisons reduced the amount borrowed for future loans by 16%. (There was no effect on likelihood of taking out a loan.)
Typical repayment profile
The third treatment provided information on the typical repayment profile for a customer.
Customers provided with the typical repayment profile reduced future sums borrowed by 12%. (There was no effect on likelihood of taking out a loan.) This change might be because the information reduced the overoptimism of the borrower as to their future actions and financial situation .
21.5 Credit card transparency
Buell and Choi (2019) examined a large nationwide retail bank showed the trade-offs associated with credit cards at the beginning of the sale process. Monthly spending by those who saw the trade-offs was 10% higher, with 20% lower cancellation rates and 10% fewer late payments.
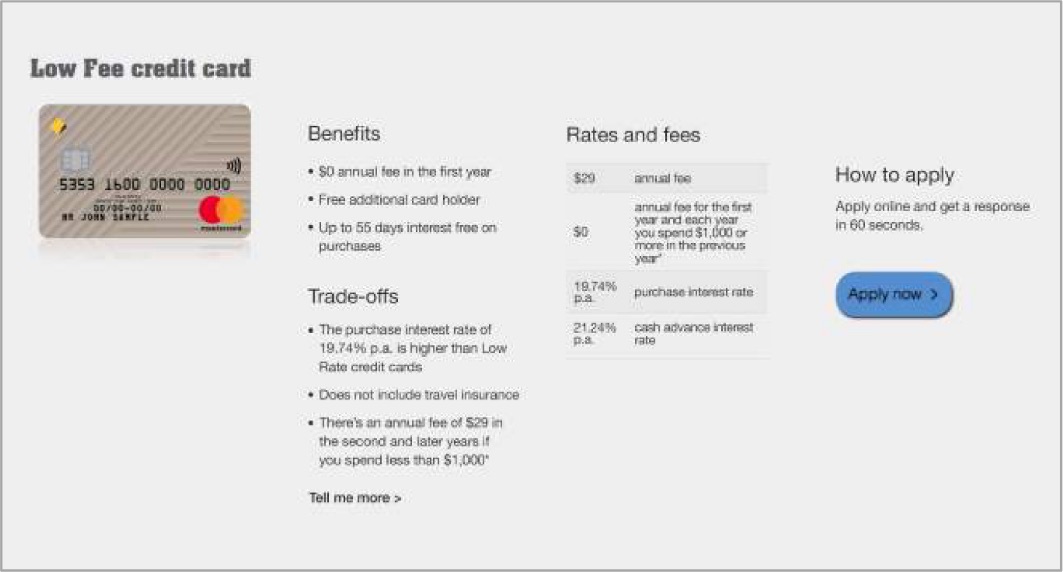
It is not clear exactly how the transparency measure worked, but may be due to both selection effects (people got cards more suited to their needs) or an education effect (they used the card better).