Basic economic theory suggests that people invest to earn returns to maximise and smooth consumption. Given this basic objective, there are numerous “puzzles” present in the way that people actually behave.
In this chapter we will look at these “puzzles” where behaviour is inconsistent with traditional economic explanations, and examine possible explanations that can account for the observed behaviour.
15.1 Low rates of stock market participation
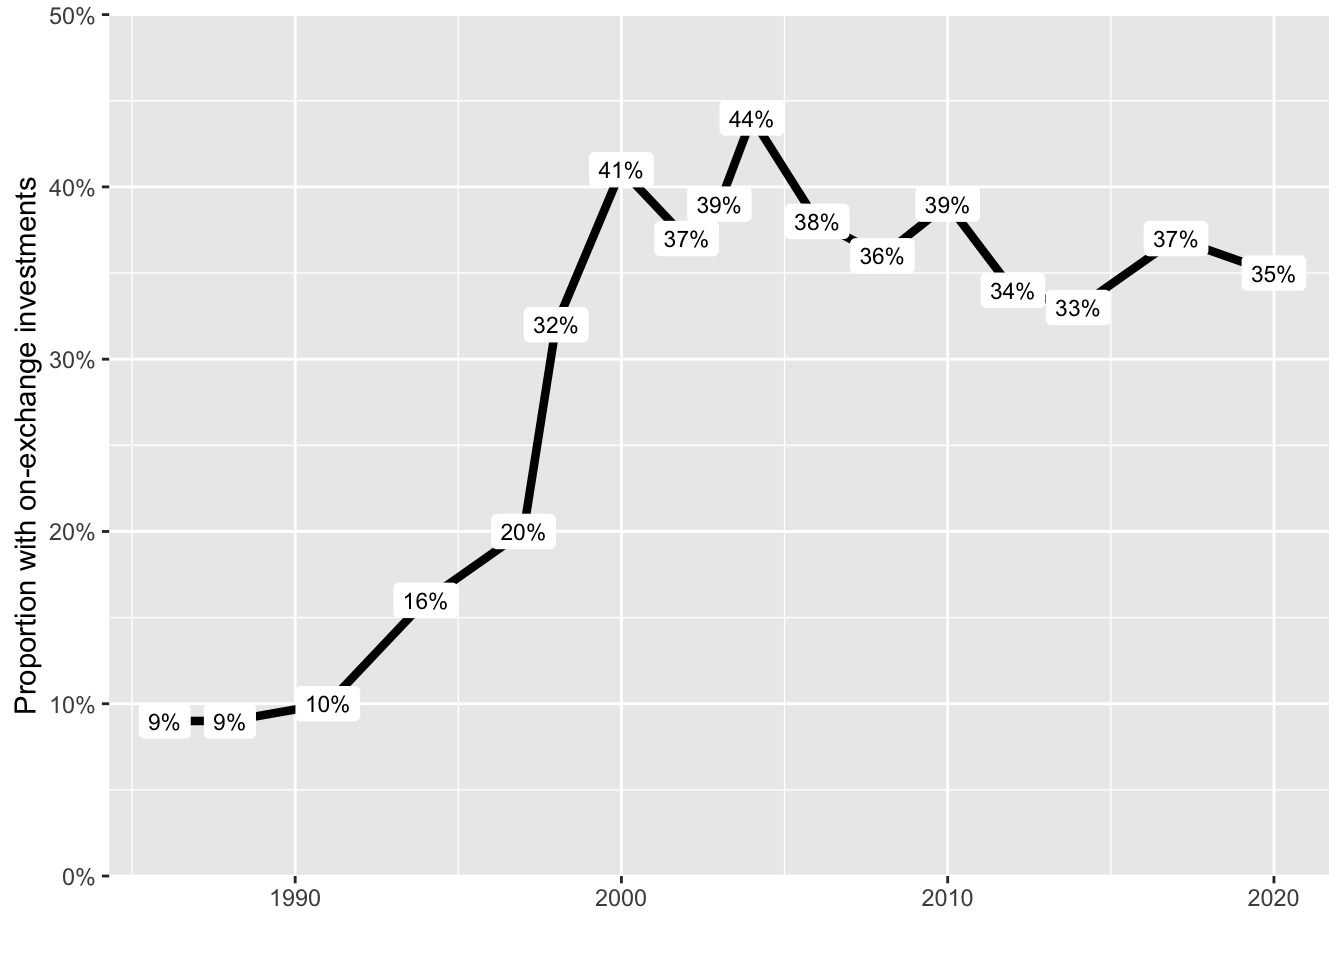
Australia has one of the highest rates of share market participation in the world. In 2020, 35% of Australian adults held on-exchange investments (ASX (2020)). This level is a drop from 44% in the early to mid-2000s, but above the 10% participation in many countries in Europe. Part of the reason for the high levels of Australian ownership is the large public offerings associated with the sale of public assets, including the Commonwealth Bank in 1991, Qantas in 1993 and Telstra in 1997.
Figure 15.1: Proportion of Australians on-exchange investments (ASX (2020))
Despite the relatively high level of Australian ownership, there is still a question why barely more than a third of Australians own shares. If the stock market is not correlated with other income sources, there is a benefit of diversification by owning some shares.
One rational explanation for low participation are costs such as acquiring information or opening a trading account. Even though these costs are small, the small financial wealth of most households means that their level of participation would also be small. However, these costs cannot be the only explanation, as many at the top of the wealth distribution also do not participate.
There are many behavioural explanations for non-participation. One is disappointment aversion, which is the tendency to make choices in a way that reduces the potential for future expected disappointment. (Disappointment is closely tied to and often an alternative name for “regret” in the behavioural literature.) Disappointment occurs when an outcome falls short of the person’s reference point, such as the expected utility of the lottery or the certainty equivalent. Someone who is disappointment averse will be less attracted to a gamble that an expected utility maximiser due to that potential disappointment. Stock market participation, obviously, provides an opportunity for disappointment (Ang et al. (2005)).
Loss aversion could provide another potential behavioural explanation, but it is inadequate to explain the rejection of small, favourable stock market investments. However, it may provide an explanation when combined with narrow framing (Barberis et al. (2006)). Narrow framing occurs where people evaluate gambles in isolation. They do not place the gamble in the context of other gambles they are taking. But combined with a narrow frame, whereby they don’t consider their full basket of risks, the potential for loss becomes clear.
There is also a link between stock market participation and knowledge. Those with more schooling, higher IQ or higher financial literacy are more likely to participate in the stock market (Cole et al. (2014), Grinblatt et al. (2011), Rooij et al. (2011)).
Finally, an assessment that more people should participate in the stock market has an implicit assumption that people will participate optimally, such as by buying a diversified portfolio. However, there is a risk that if they did invest in the stock market, they would exhibit many of the problems identified on this page, including a lack of diversification and overtrading. In practice, it might be better if some households stayed out. That is the topic of the next tab.
15.2 Under-diversification
Those who invest in shares often hold an undiversified portfolio. The median US household holds around two stocks directly (Kelly (1995), Barber and Odean (2000)). Households also disproportionately hold stocks from their own country, with only 15% of Australians directly holding foreign shares (ASX (2020)).
There is some evidence that those with undiversified portfolios earn outsize returns, due to factors such an information advantage. (For example, see Ivković et al. (2008). In contrast, Seasholes and Zhu (2010) finds no advantage.). However, even if this is the case, outsize return comes with increased risk. It is not clear that the higher return compensates for the greater risk.
As you will recall, one of the questions in the basic financial literacy questionnaire concerns diversification. Lower financial literacy is linked to lower diversification (Abreu and Mendes (2010), Gaudecker (2015)).
Even when we do diversify, we often use crude metrics such as the 1/n rule, in which investments are simply spread across options in equal proportions (for example, Benartzi and Thaler (2001)). This means that if more shares are offered in a menu of options, we will end up with a great proportion of shares in our portfolio.
But is this irrational? The following story from Bower (2011) about a pioneer of modern portfolio theory raises some questions.
Harry Markowitz won a 1990 Nobel Prize in economics for efficiently passing the buck — make that bucks. He was honored for developing a mathematical formula that helps investors maximize profit and minimize loss in their portfolios. After an exhaustive analysis of financial information, Markowitz’s procedure allocates a per- son’s stash of cash to an array of assets, with more money going to better bets.
Many banks rely on this or similar investment approaches, warning customers to avoid picking investments intuitively. Yet Markowitz, now at the University of California, San Diego, followed a hunch in 1952 when he split paycheck contributions to his retirement account equally between stocks and bonds.
Economists call this simple approach “1 over N,” distributing money evenly among the number of available investment options, the Ns. The 1/N strategy is also called “naïve diversification,” a presumably second-rate alternative to crunching the numbers and calculating gain and loss probabilities for each potential investment. Nonetheless, many people with stock-and-bond retirement accounts opt for an even split.
As a young economist, Markowitz just wanted to avoid future regrets about fouling up his nest egg. “I thought, ‘You know, if the stock market goes way up and I’m not in it, I’ll feel stupid. And if it goes way down and I’m in it, I’ll feel stupid,’” he recalls. “So I went 50–50.”
Markowitz did not follow the optimal behaviour as defined by himself. Was Markowitz erring?
Brighton and Gigerenzer (2015) argue that optimisation is not always the best solution. Where a problem is computationally intractable or the optimisation solution lacks robustness due to estimation errors, heuristics may outperform. For example, DeMiguel et al. (2009) compared the performance of the 1/N rule with 14 other asset allocation models, including Markowitz’s portfolio allocation model. Across 7 empirical datasets, none of the 14 models outperformed the 1/N rule on out-of-sample tests. There is now a substantial literature in support of and contesting this finding (for example, Kritzman et al. (2010) and Hsu et al. (2018)).
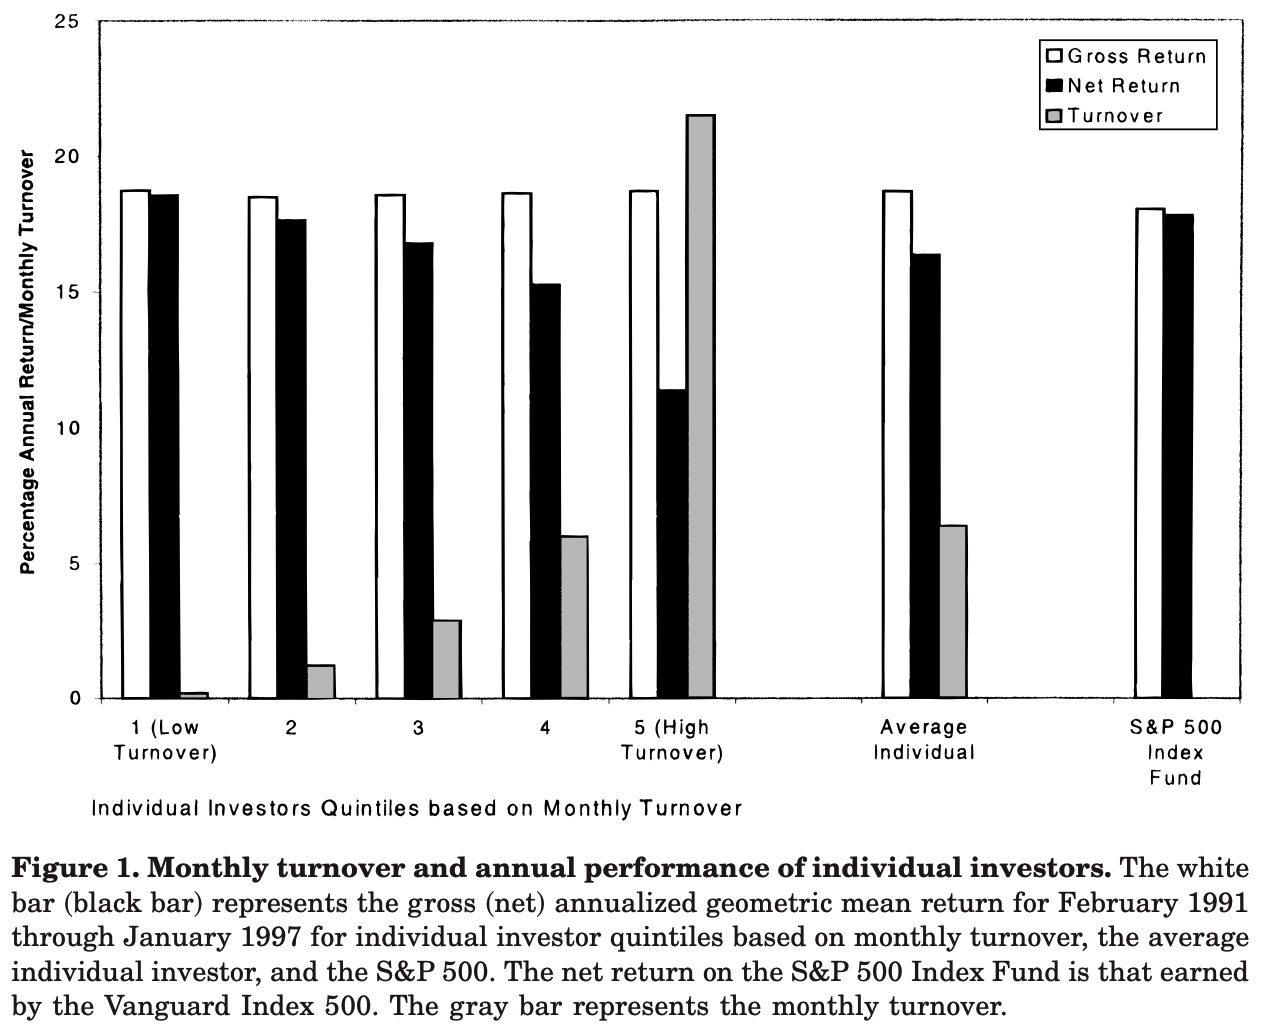
On average, the more people trade, the worse they perform (Barber and Odean (2000)). This is driven largely, but not solely, by transaction costs.
Figure 15.2: Monthly turnover and annual performance of individual investor (Figure 1 in Barber and Odean (2000))
Overconfidence is regularly proposed as an explanation for excessive trading behaviour (for example, Odean (1998)). Those who believe they are better than others (overplace) trade more (for example, Grinblatt and Keloharju (2009)). There is mixed evidence in support of a link between overprecision and over-trading (for example, Deaves et al. (2009) and Glaser and Weber (2007)).
There is also a difference by gender. Men trade more than women, and suffer a larger trading penalty as a result (Barber and Odean (2001)).
15.4 Poor investment options
One cheap, easy option to achieve stock market diversification is a low-cost managed fund. However, people hold individual stocks more often than you would expect given the diversification benefits of a fund. Then when they choose funds, they often choose actively managed funds,which typically underperform passively managed funds. And of those they choose, they pay high fees.
One rational explanation involves the broker or adviser. Funds tend to flow to funds with higher commissions (Christoffersen et al. (2013)), suggesting the broker is acting in their own interest. Conflicted remuneration has been severely curtailed in Australia in recent years, and low-cost index funds have become increasingly available. This change may influence the proportion of funds in high-fee funds in the future.
There is some evidence that financial illiteracy is a cause of poor fund choice. High-IQ investors choose cheaper funds (Grinblatt et al. (2016)). But even when clear fee information is given to an ostensibly bright group (Harvard and Wharton students and staff) with which to choose between four index funds, many fail to minimise fees (Choi et al. (2010)). This failure suggests a lack of financial sophistication even among that group.
15.5 The disposition effect
The disposition effect is the tendency for investors to sell stocks that are in the gain domain relative to the purchase price and to hold stocks that are in the loss domain (Shefrin and Statman (1985)).
While tax implications or portfolio rebalancing are both potential explanations for asymmetric behaviour relating to the sale of stocks, these factors have been shown to be insufficient to explain the observed behaviour.
Most behavioural explanations have turned to prospect theory.
For example, Shefrin and Statman (1985) argued that the disposition effect is driven by the reflection effect, whereby investors are risk seeking in the loss domain and risk averse in the gain domain. To demonstrate how it works, they present the following scenario:
[C]onsider an investor who purchased a stock one month ago for $50 and who finds that the stock is now selling at $40. The investor must now decide whether to realize the loss or hold the stock for one more period. To simplify the discussion, assume that there are no taxes or transaction costs. In addition, suppose that one of two equiprobable outcomes will emerge during the coming period: either the stock will increase in price by $10 or decrease in price by $10. According to prospect theory, our investor frames his choice as a choice between the following two lotteries:
A. Sell the stock now, thereby realizing what had been a $10 “paper loss”.
B. Hold the stock for one more period, given 50-50 odds between losing an additional $10 or “breaking even.”
For an investor who is risk seeking in the loss domain, option B would be attractive.
If we craft an alternative scenario where the stock is now selling at $60, selling would realise a $10 gain, while holding the stock would be a risky prospect with the same expected value. An investor who is risk averse in the gain domain will sell.
Barber, B. M., and Odean, T. (2001). Boys will be boys: Gender, overconfidence, and common stock investment*. The Quarterly Journal of Economics, 116(1), 261–292. https://doi.org/10.1162/003355301556400
Barber, B. M., and Odean, T. (2000). Trading is hazardous to your wealth: The common stock investment performance of individual investors. The Journal of Finance, 55(2), 773–806. https://doi.org/10.1111/0022-1082.00226
Barberis, N., Huang, M., and Thaler, R. H. (2006). Individual preferences, monetary gambles, and stock market participation: A case for narrow framing. American Economic Review, 96(4), 1069–1090. https://doi.org/10.1257/aer.96.4.1069
Benartzi, S., and Thaler, R. H. (2001). Naive diversification strategies in defined contribution saving plans. American Economic Review, 91(1), 79–98. https://doi.org/10.1257/aer.91.1.79
Bower, B. (2011). Simple heresy: Rules of thumb challenge complex financial analyses: Simple heresy: Rules of thumb challenge complex financial analyses. Science News, 179(12), 26–29. https://doi.org/10.1002/scin.5591791221
Choi, J. J., Laibson, D., and Madrian, B. C. (2010). Why does the law of one price fail? An experiment on index mutual funds. The Review of Financial Studies, 23(4), 1405–1432. https://doi.org/10.1093/rfs/hhp097
Christoffersen, S. E. K., Evans, R., and Musto, D. K. (2013). What do consumers’ fund flows maximize? Evidence from their brokers’ incentives. The Journal of Finance, 68(1), 201–235. https://doi.org/10.1111/j.1540-6261.2012.01798.x
Cole, S., Paulson, A., and Shastry, G. K. (2014). Smart money? The effect of education on financial outcomes. Review of Financial Studies, 27(7), 2022–2051. https://doi.org/10.1093/rfs/hhu012
Deaves, R., Lüders, E., and Luo, G. Y. (2009). An experimental test of the impact of overconfidence and gender on trading activity. Review of Finance, 13(3), 555–575. https://doi.org/10.1093/rof/rfn023
DeMiguel, V., Garlappi, L., and Uppal, R. (2009). Optimal versus naive diversification: How inefficient is the 1/ n portfolio strategy? Review of Financial Studies, 22(5), 1915–1953. https://doi.org/10.1093/rfs/hhm075
Gaudecker, H.-M. V. (2015). How does household portfolio diversification vary with financial literacy and financial advice? The Journal of Finance, 70(2), 489–507. https://doi.org/10.1111/jofi.12231
Grinblatt, M., Ikäheimo, S., Keloharju, M., and Knüpfer, S. (2016). IQ and mutual fund choice. Management Science, 62(4), 924–944. https://doi.org/10.1287/mnsc.2015.2166
Grinblatt, M., Keloharju, M., and Linnainmaa, J. (2011). IQ and stock market participation. The Journal of Finance, 66(6), 2121–2164. https://www.jstor.org/stable/41305186
Hsu, P.-H., Han, Q., Wu, W., and Cao, Z. (2018). Asset allocation strategies, data snooping, and the 1 / n rule. Journal of Banking & Finance, 97, 257–269. https://doi.org/10.1016/j.jbankfin.2018.09.021
Ivković, Z., Sialm, C., and Weisbenner, S. (2008). Portfolio concentration and the performance of individual investors. Journal of Financial and Quantitative Analysis, 43(3), 613–655. https://doi.org/10.1017/S0022109000004233
Kelly, M. (1995). All their eggs in one basket: Portfolio diversification of US households. Journal of Economic Behavior & Organization, 27(1), 87–96. https://doi.org/10.1016/0167-2681(95)00006-E
Kritzman, M., Page, S., and Turkington, D. (2010). In defense of optimization: The fallacy of 1/ n. Financial Analysts Journal, 66(2), 31–39. https://doi.org/10.2469/faj.v66.n2.6
Odean, T. (1998). Volume, volatility, price, and profit when all traders are above average. The Journal of Finance, 53(6), 1887–1934. https://doi.org/10.1111/0022-1082.00078
Rooij, M. van, Lusardi, A., and Alessie, R. (2011). Financial literacy and stock market participation. Journal of Financial Economics, 101(2), 449–472. https://doi.org/10.1016/j.jfineco.2011.03.006
Shefrin, H., and Statman, M. (1985). The disposition to sell winners too early and ride losers too long: Theory and evidence. The Journal of Finance, 40(3), 777–790. https://doi.org/10.1111/j.1540-6261.1985.tb05002.x